The first supply chain planning system with Second Intelligence.
Demand, inventory and supply. Connected by intelligence. Directed by you.
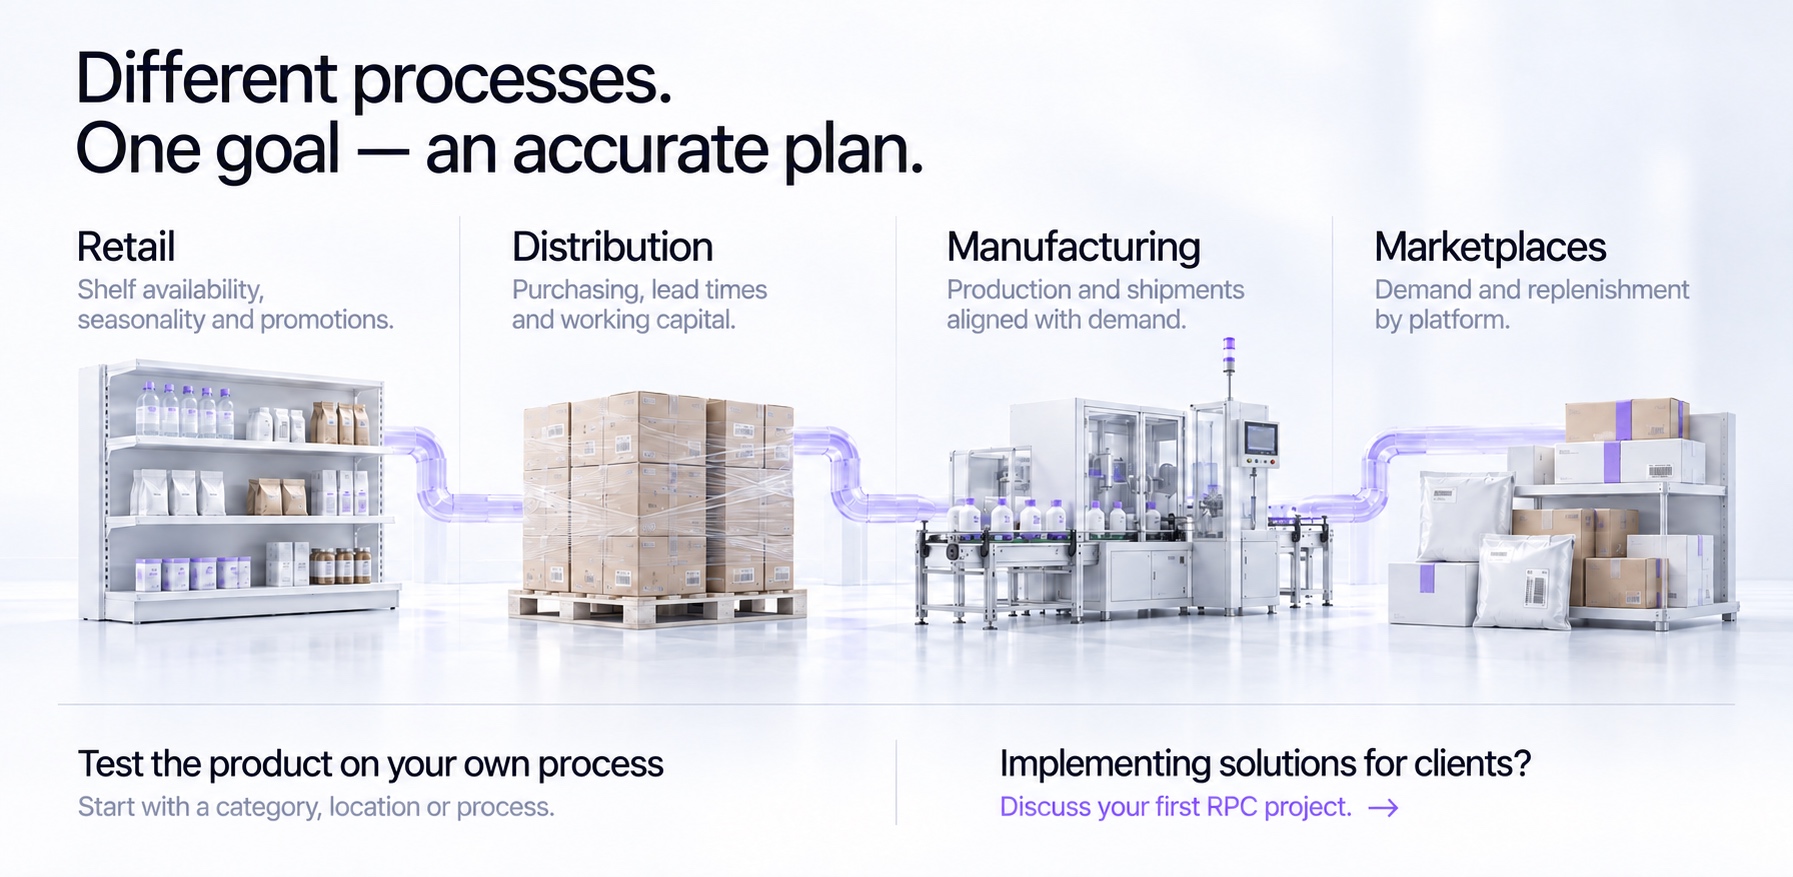
Retail
Assortment and on-shelf availability.
HoReCa
Cafés, restaurants and bakeries: production, freshness and daily orders.
Distribution
Purchasing, lead times and working capital.
Manufacturing
Production and deliveries aligned with demand.
Marketplaces
Demand and replenishment across platforms.
For integrators and consultants: bring a first RPC AI project to your client.
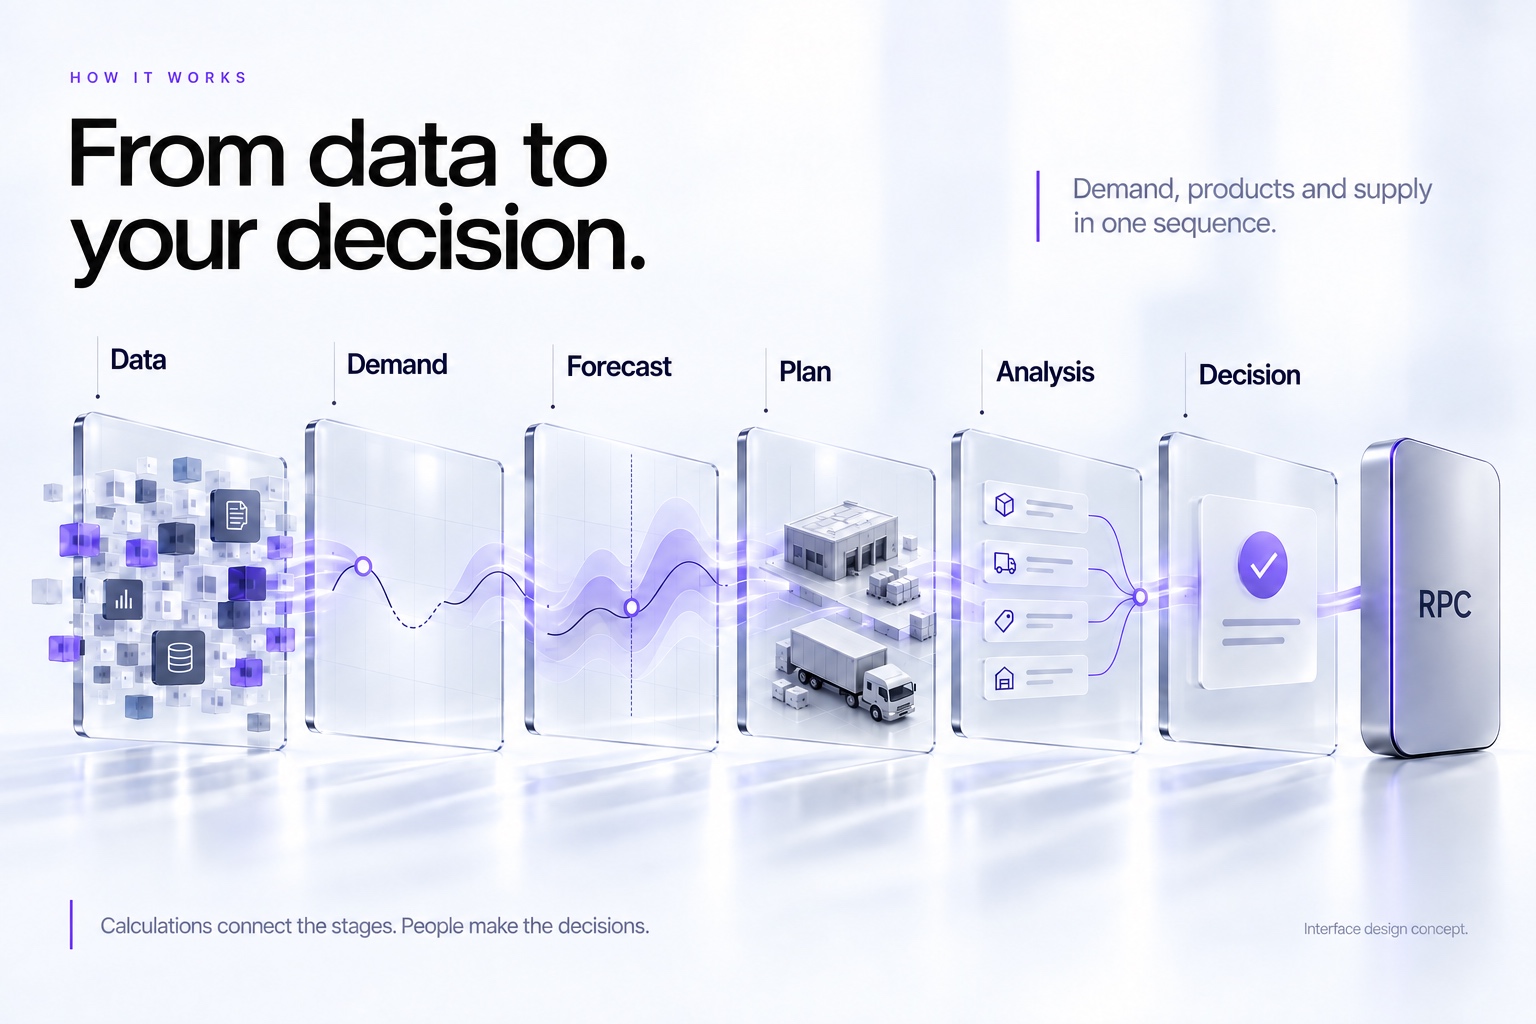
One system. From data to decision.
Data, demand, forecasts, inventory and supply are connected. Second Intelligence helps explain the causes; people make the decisions.
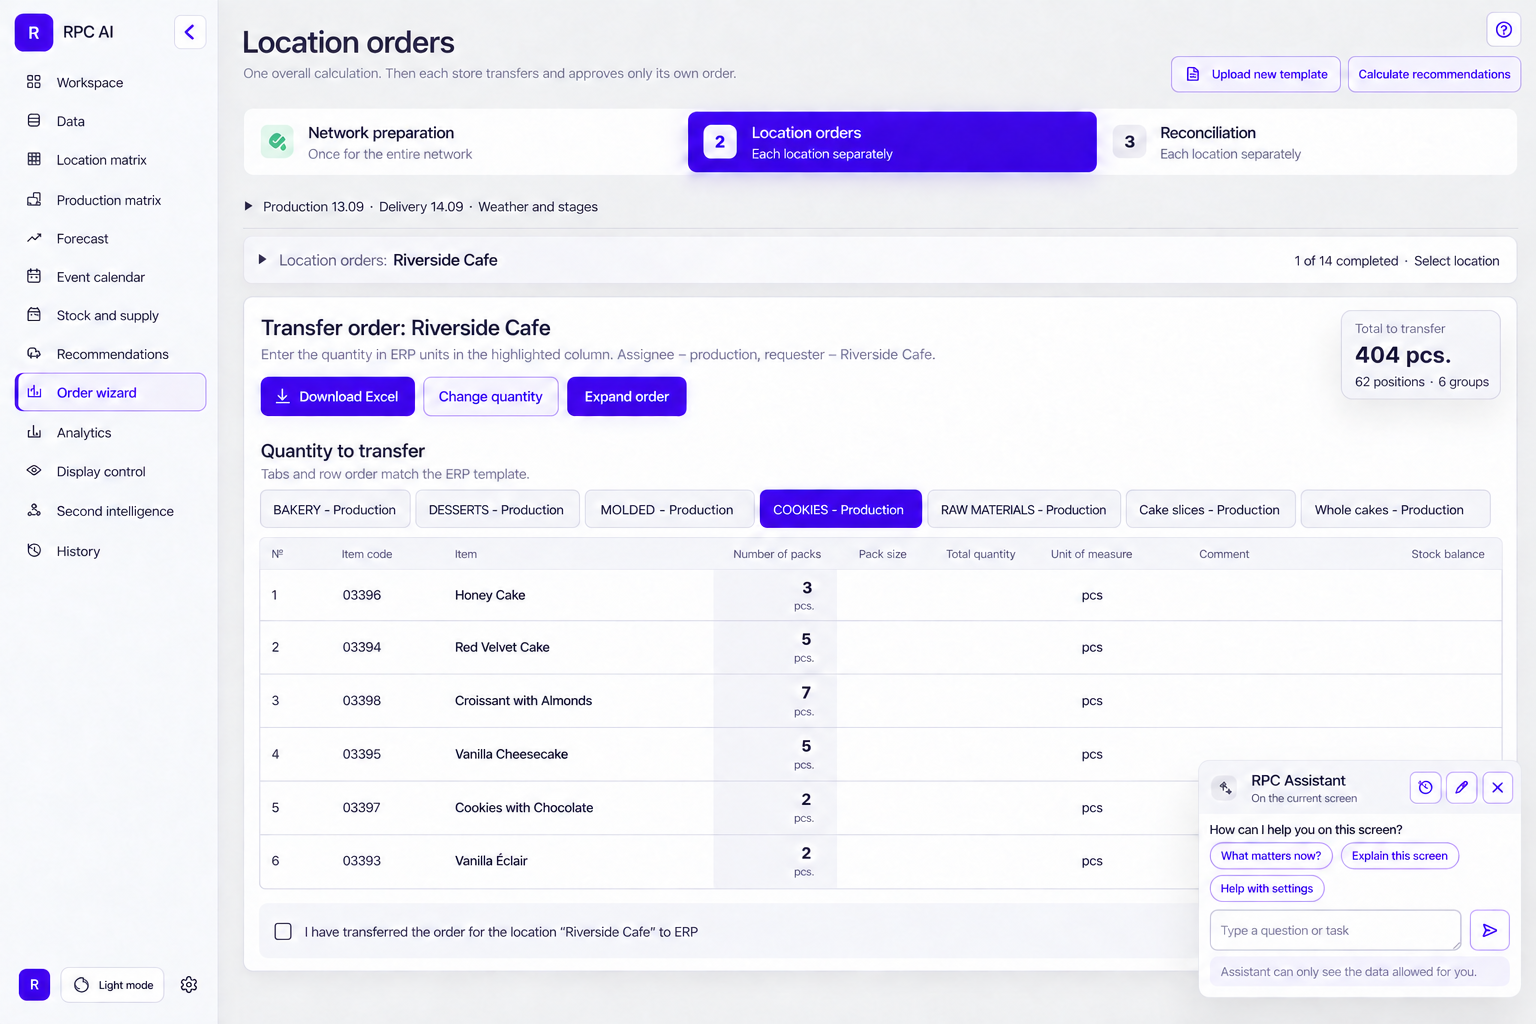
One shared plan. A clear order for every location.
From calculating requirements to an order your team can work with. Preparation, transfer and reconciliation are visible in one working process.
Location orders
One calculation across the network
Prepare recommendations centrally, then open the order for an individual location.
Familiar product groups
Quantities, pack sizes and categories stay together. Expand, adjust and export the order.
Transfer and reconcile with your ERP
The team transfers the order to its ERP and records when each step is complete.
A forecast you can understand.
From cleaning history and accounting for demand drivers to the right level of detail, manual adjustments and change history. Four screens show the different parts of this work.
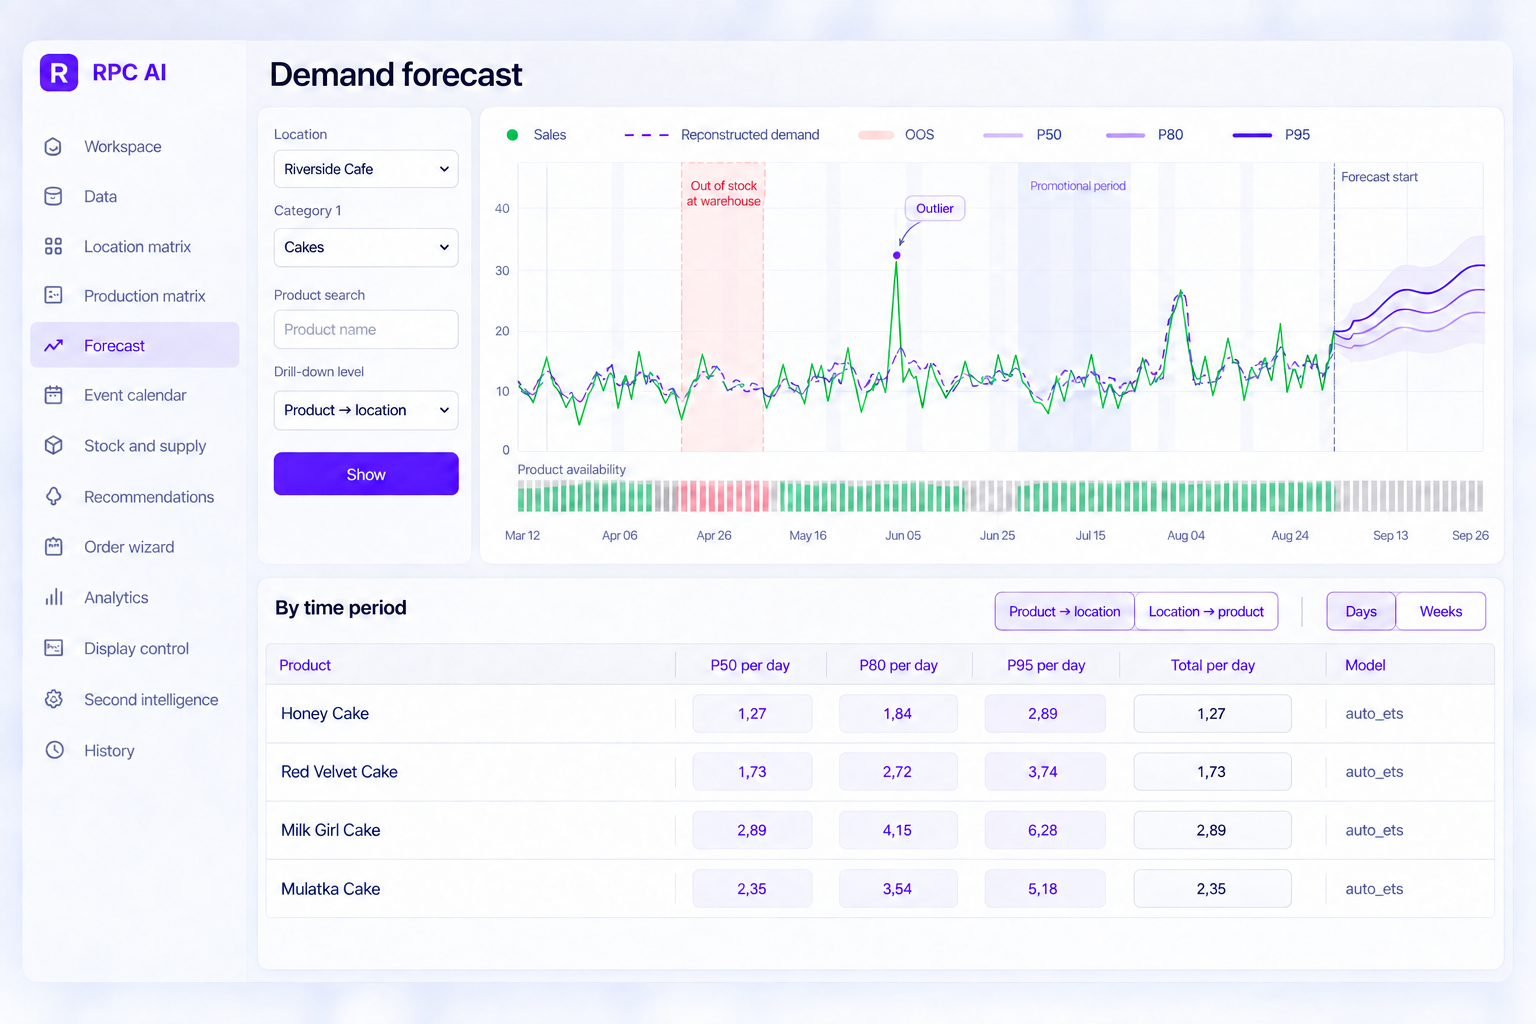
Sales are not the whole demand story.
One chart shows sales, reconstructed demand and periods that need a closer look.
Outliers
Unusual spikes are highlighted in the history, so you can distinguish demand from distortions.
Out-of-stock periods
RPC AI compares sales with availability and reconstructs demand during stockouts.
Separate promotions from the baseline
Promotional periods are considered separately so a one-off uplift does not become regular demand.
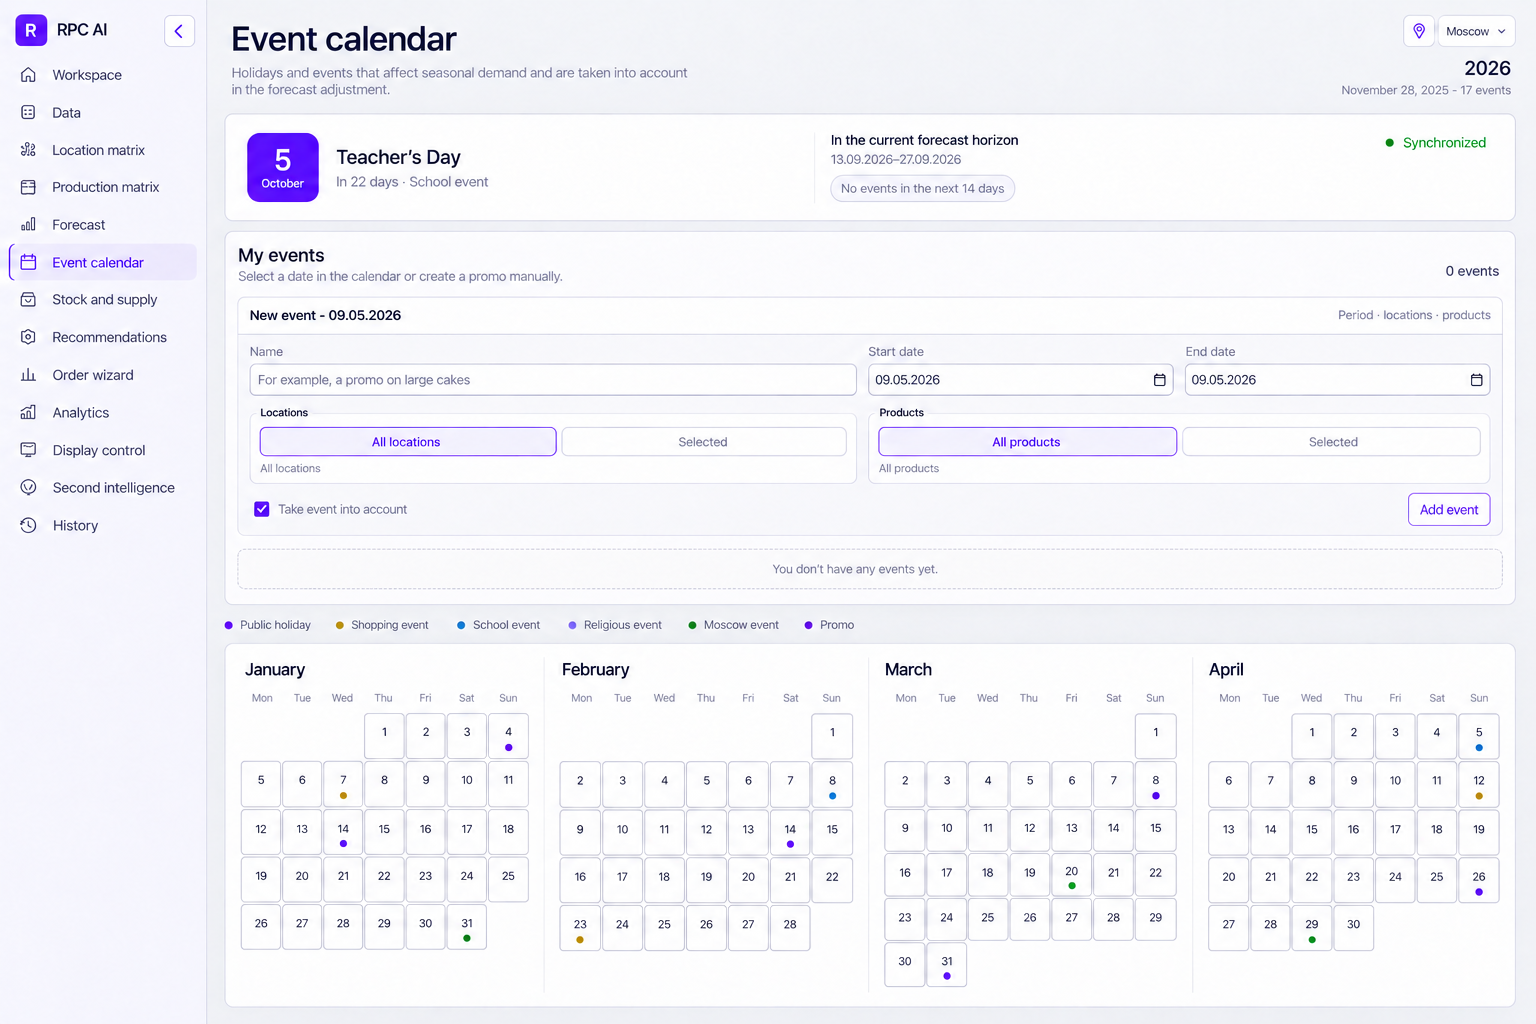
Events in your demand calendar.
Holidays, events and promotions are linked to dates, products and locations. The calendar keeps a familiar structure: event, scope and monthly view.
Your own events
Set a name and date range, then select all or specific products and locations.
Weather and seasonality
The weather strip on the forecast chart helps compare demand changes with conditions in that period. How factors are applied depends on data and calculation settings.
A clear historical view
Events stay linked to forecast periods, from individual days to seasonal changes.
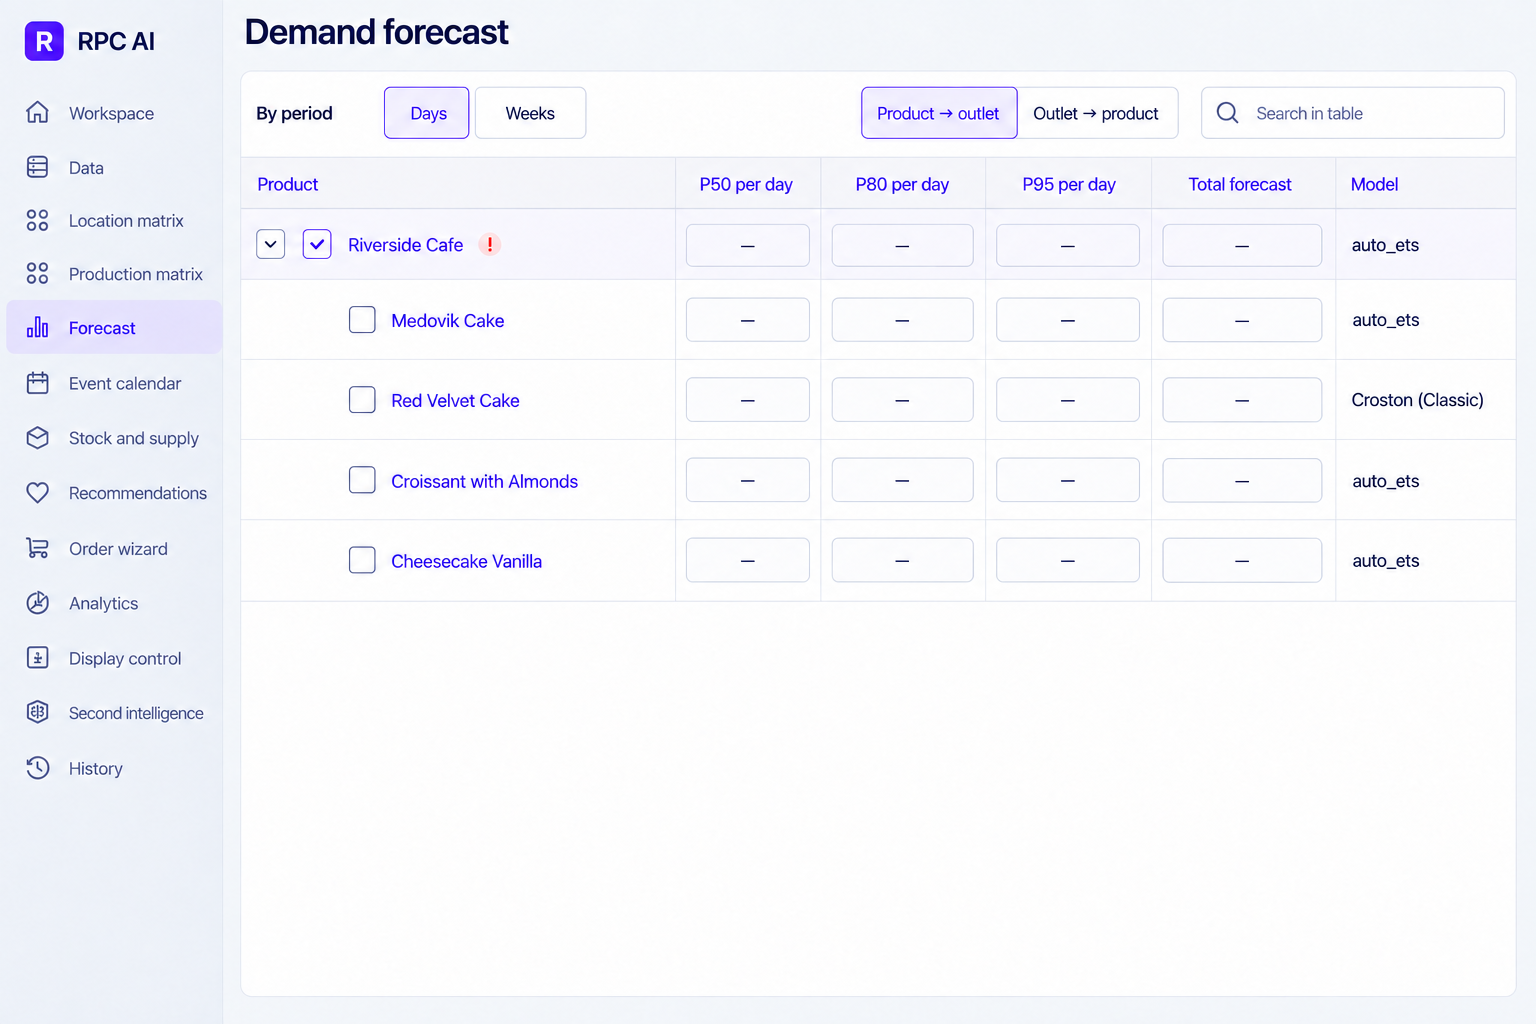
From the whole network to a product at one location.
Expand the hierarchy and compare forecasts at the level you need. Each row shows quantiles, the final value and the model used.
Aggregation and disaggregation
Move between locations, categories and products. Switch between product → location and location → product views.
DPU level
For infrequent demand, calculations can use an aggregated group and then allocate the result across the active assortment.
Model and final forecast
The model name is visible in the table. P50, P80 and P95 represent different forecast levels; the final choice remains under your control.
Adjustments under your control.
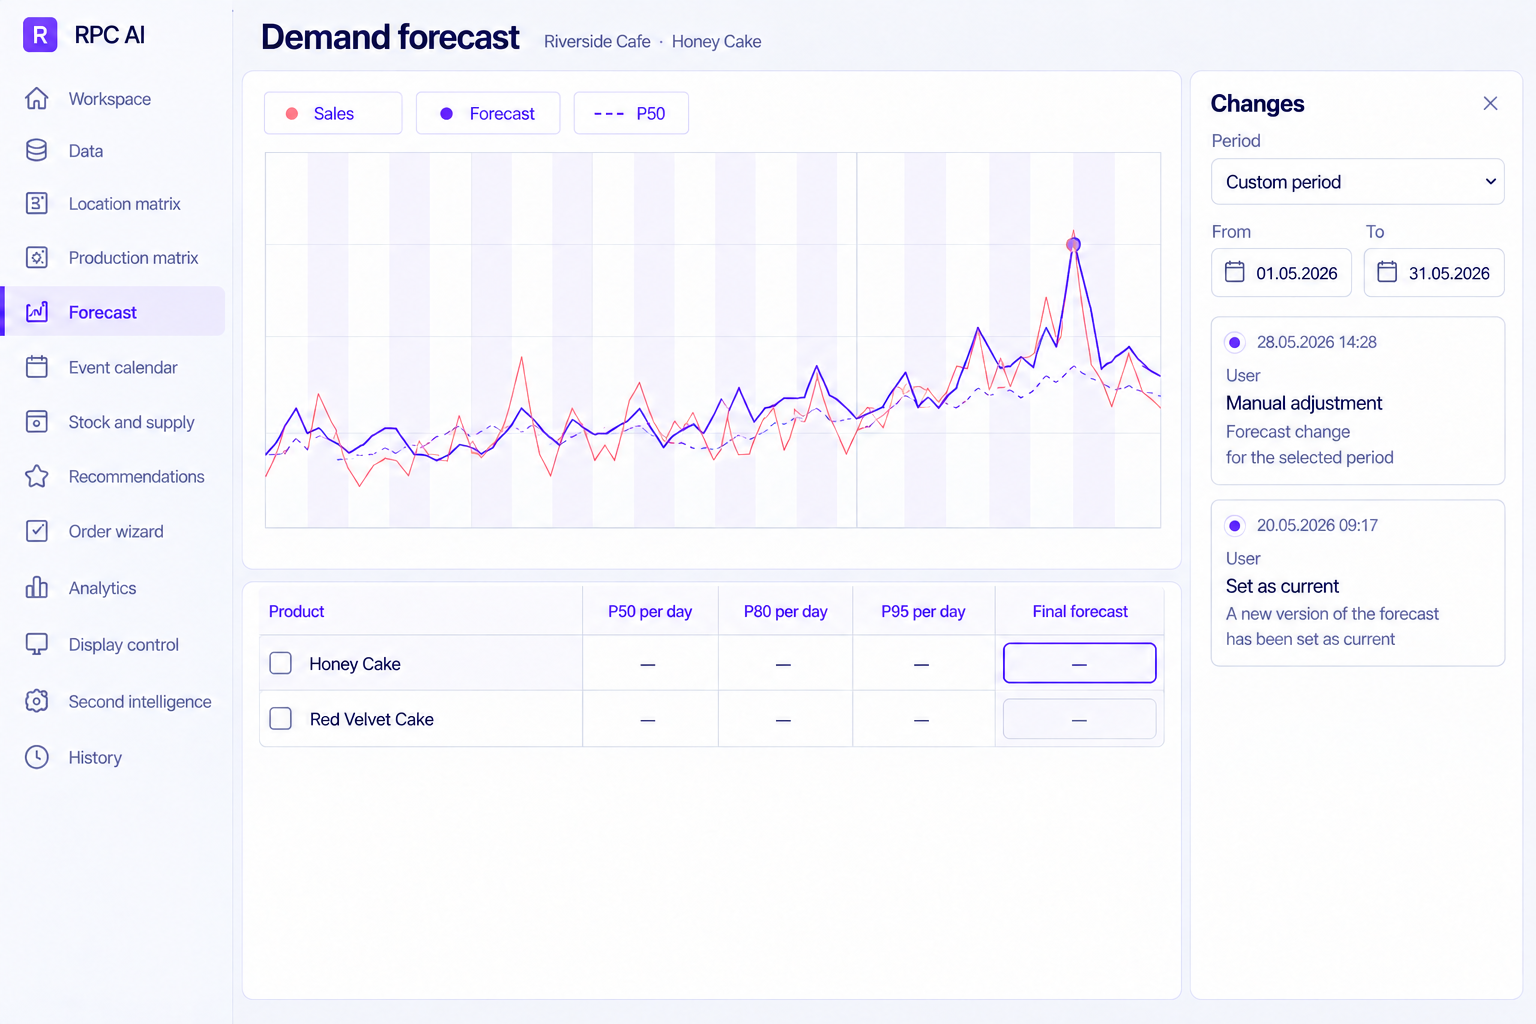
Work with the forecast in charts and tables, move between periods and retain the context of changes.
A point or a period
Adjust individual values or selected periods and compare them with the original forecast.
Quick search
Find a product, category or location and expand the relevant level without losing the wider context.
Change history
The change panel shows when a forecast changed and which version is current.
English translation of the original RPC AI interface.
1 / 4
Artificial intelligence for demand forecasting.
Machine learning finds patterns in demand history, seasonality, the calendar and weather. AutoML compares suitable models on past periods and selects a forecast based on error, stability and systematic over- or underestimation of demand.
Which models RPC AI uses
Machine learning:global LightGBM through MLForecast, trained across groups of time series using lagged, rolling and external features.
Regular demand:AutoETS, AutoTheta, AutoARIMA and Seasonal Naive.
Intermittent demand:Croston Classic, ADIDA and TSB. Candidate models depend on demand type and configuration; an available model is not necessarily run for every item.
Models are tested on historical windows without access to future data. P50, P80 and P95 are forecast quantiles, not accuracy percentages.
From assortment to production and supply.
Matrices define the rules, the plan shows requirements over time and analytics highlight where attention is needed.
Assortment and rules for every location.
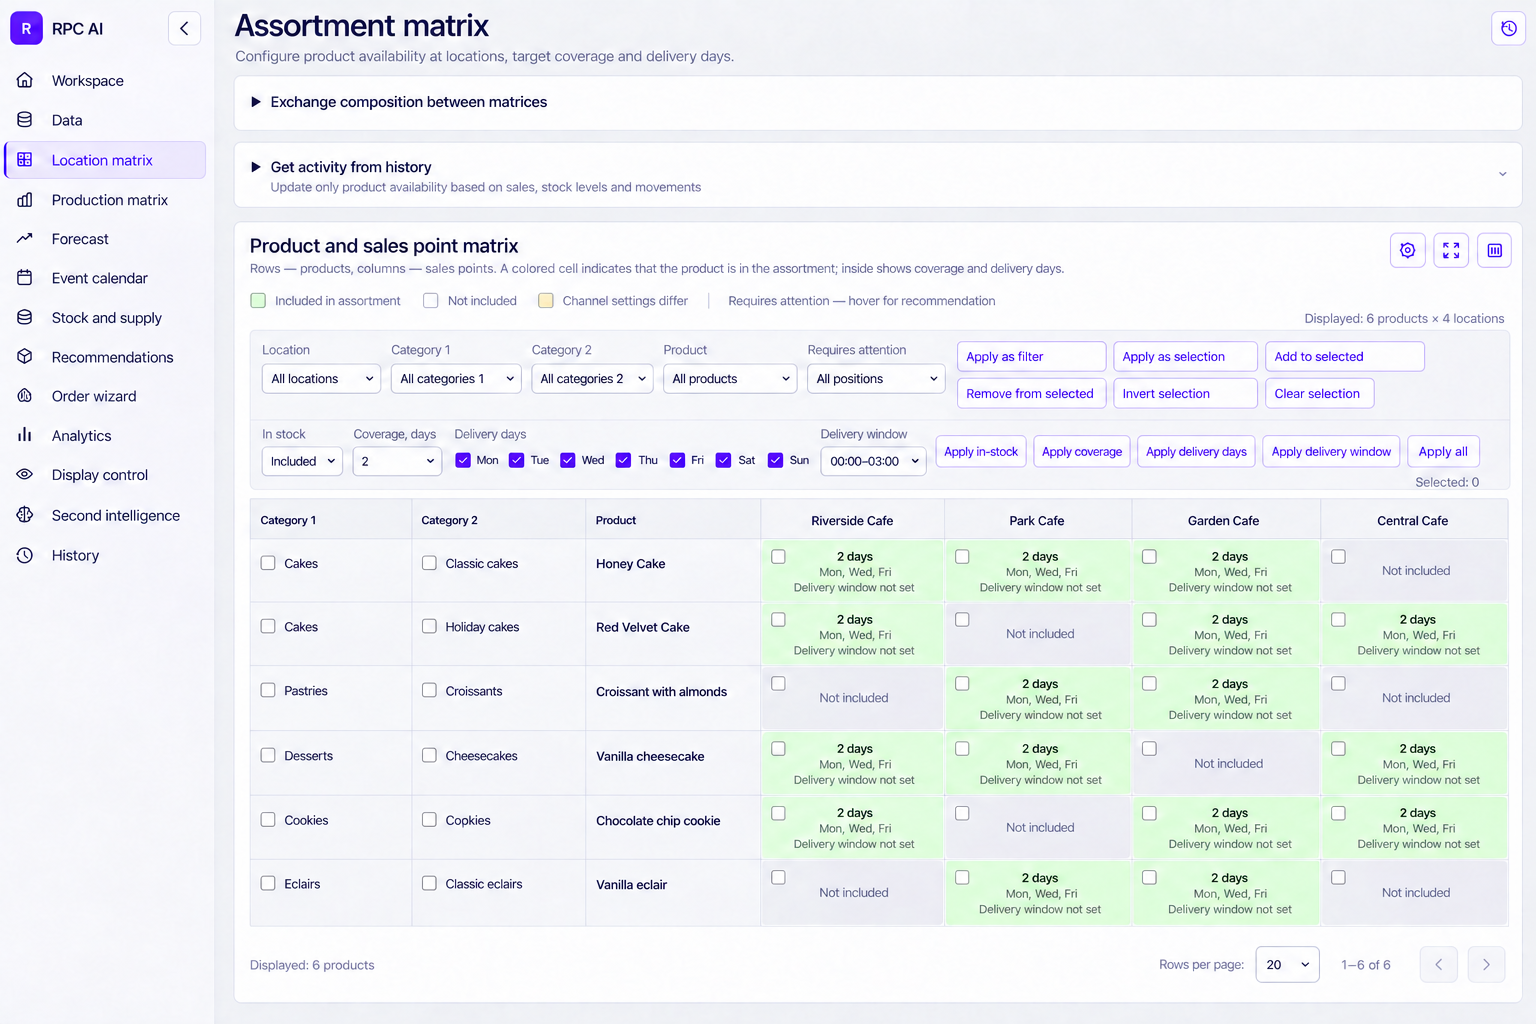
The matrix connects products and locations: where an item is active, how much coverage is needed and when deliveries can take place.
One matrix
Product status, coverage days, delivery days and delivery windows are visible in the relevant location cell.
Bulk changes
Select products and locations, then apply the required settings to the whole selected area.
Connected to production
Product ranges can be aligned across matrices. The forecast uses each location’s active assortment.
What to produce, within which constraints.
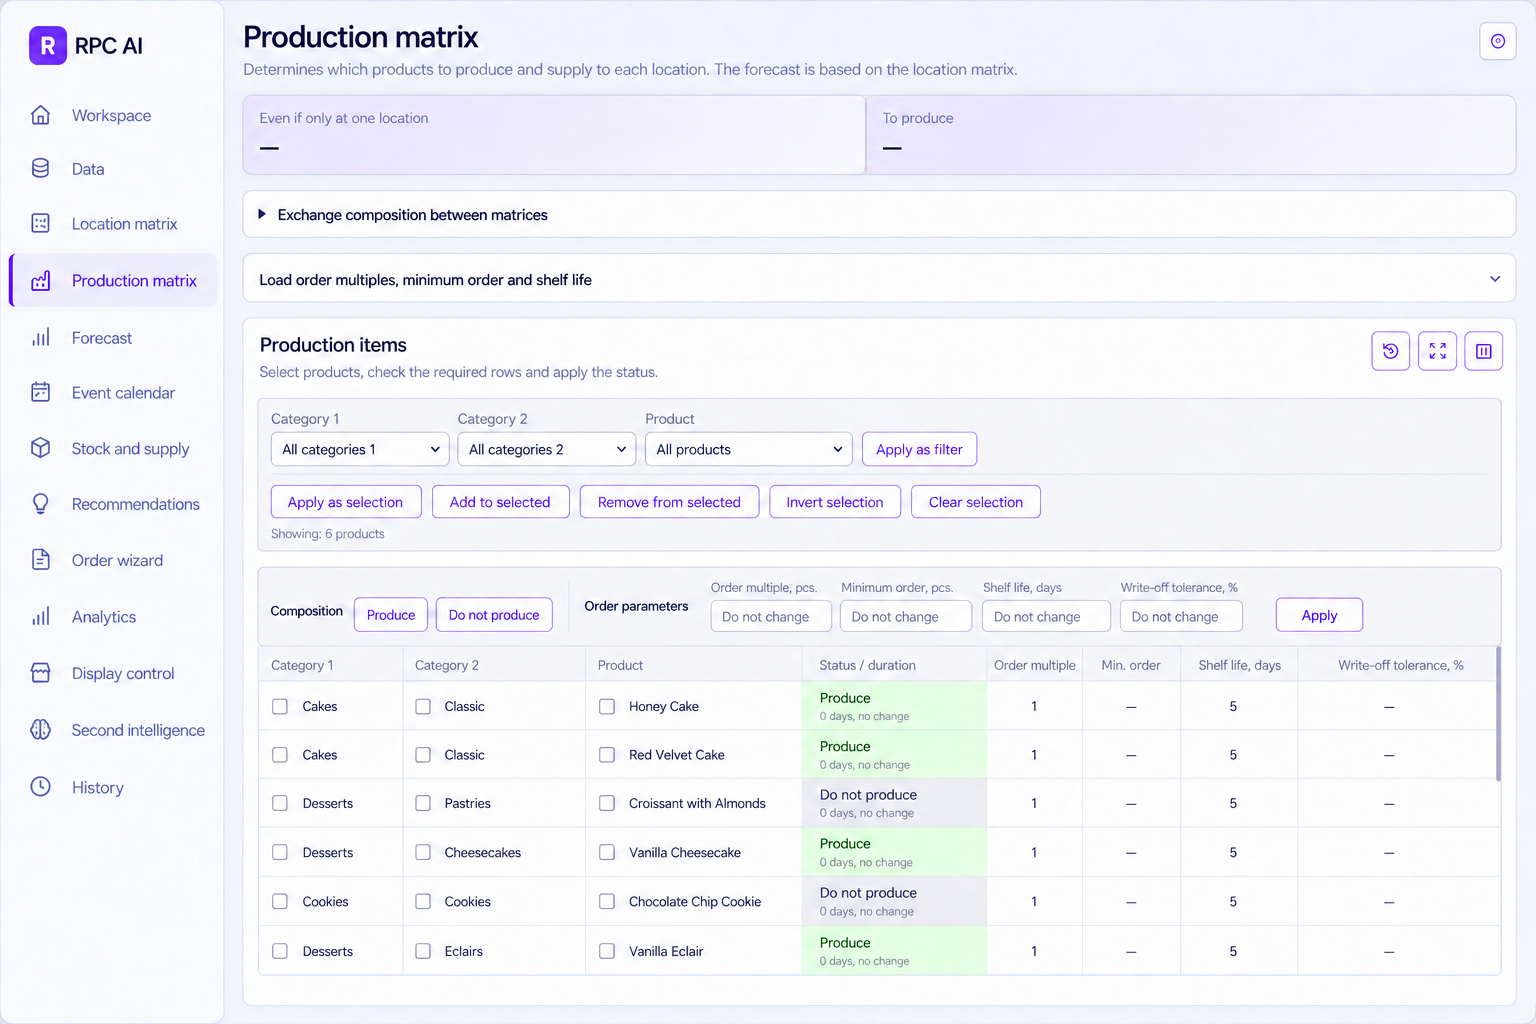
The production range is separate from each location’s assortment. Order and shelf-life parameters are set where they affect the plan.
Produce or exclude
Manage the production range by product and category.
Practical constraints
Pack multiples, minimum batch sizes and shelf life are considered when preparing the plan.
Write-off allowance
Set an explicit allowance for stock remaining at the end of shelf life, instead of using one rule for every product.
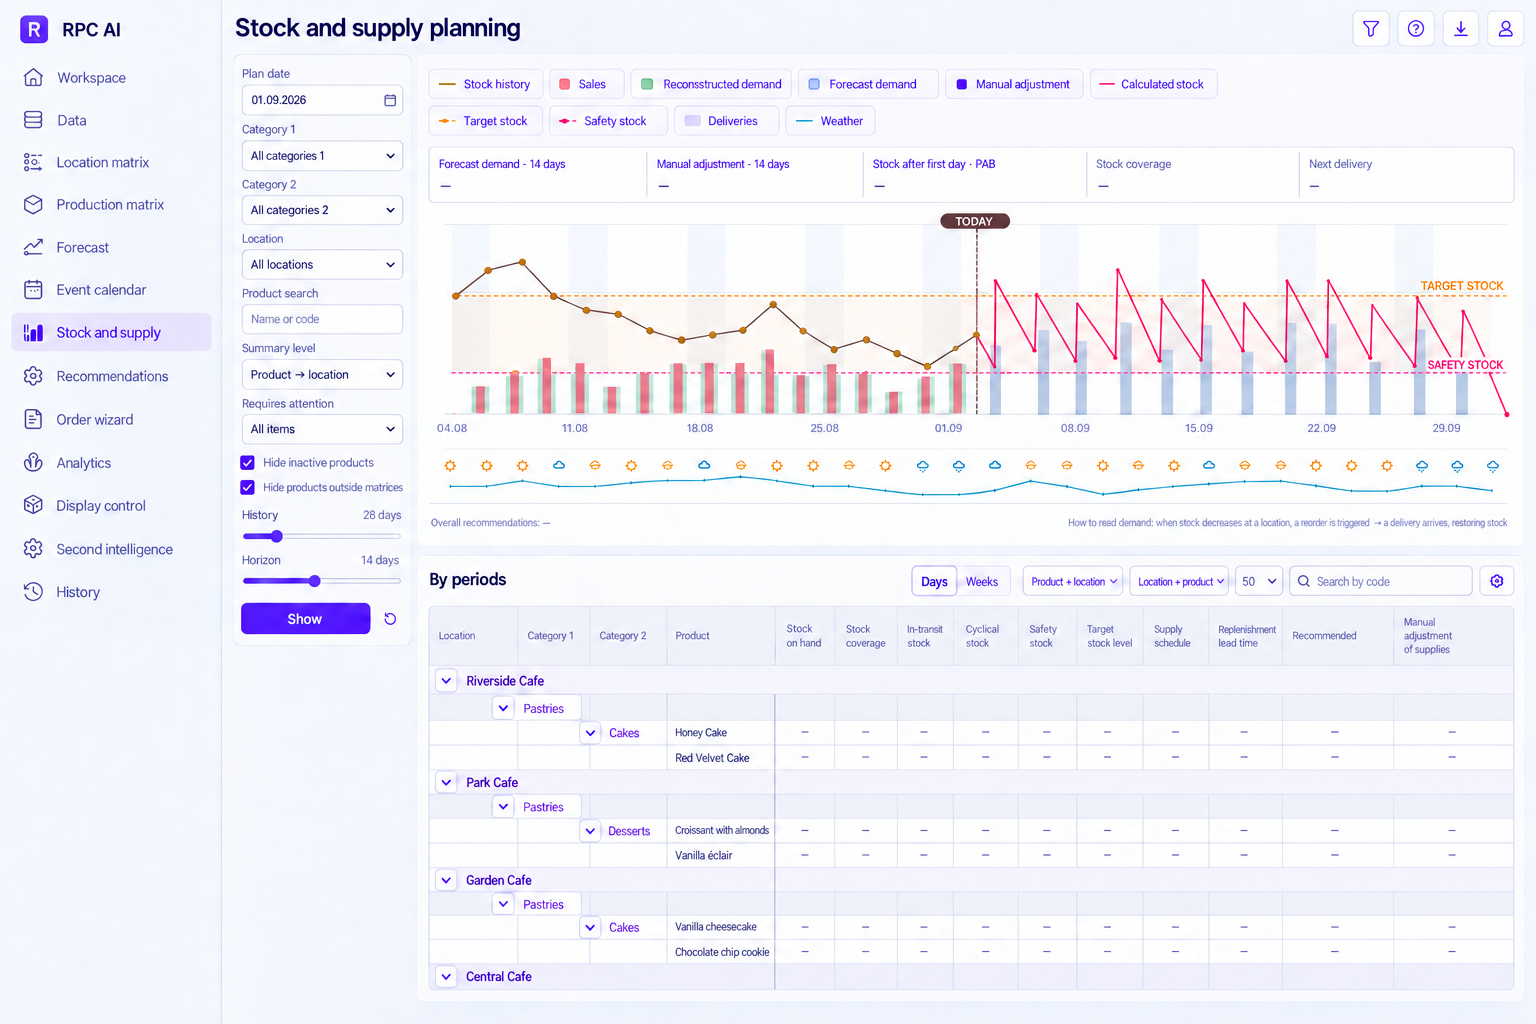
Supply connected to demand.
Stock history, requirements, receipts and projected inventory share one planning horizon. The table shows the parameters behind the plan.
See when goods are needed
The chart shows how stock changes between deliveries and against target and safety stock.
Lead times and pack multiples
The plan accounts for delivery schedules, replenishment lead times, minimum orders and batch multiples.
A result you can control
Compare the recommendation with a manual adjustment and drill down to a location or product.
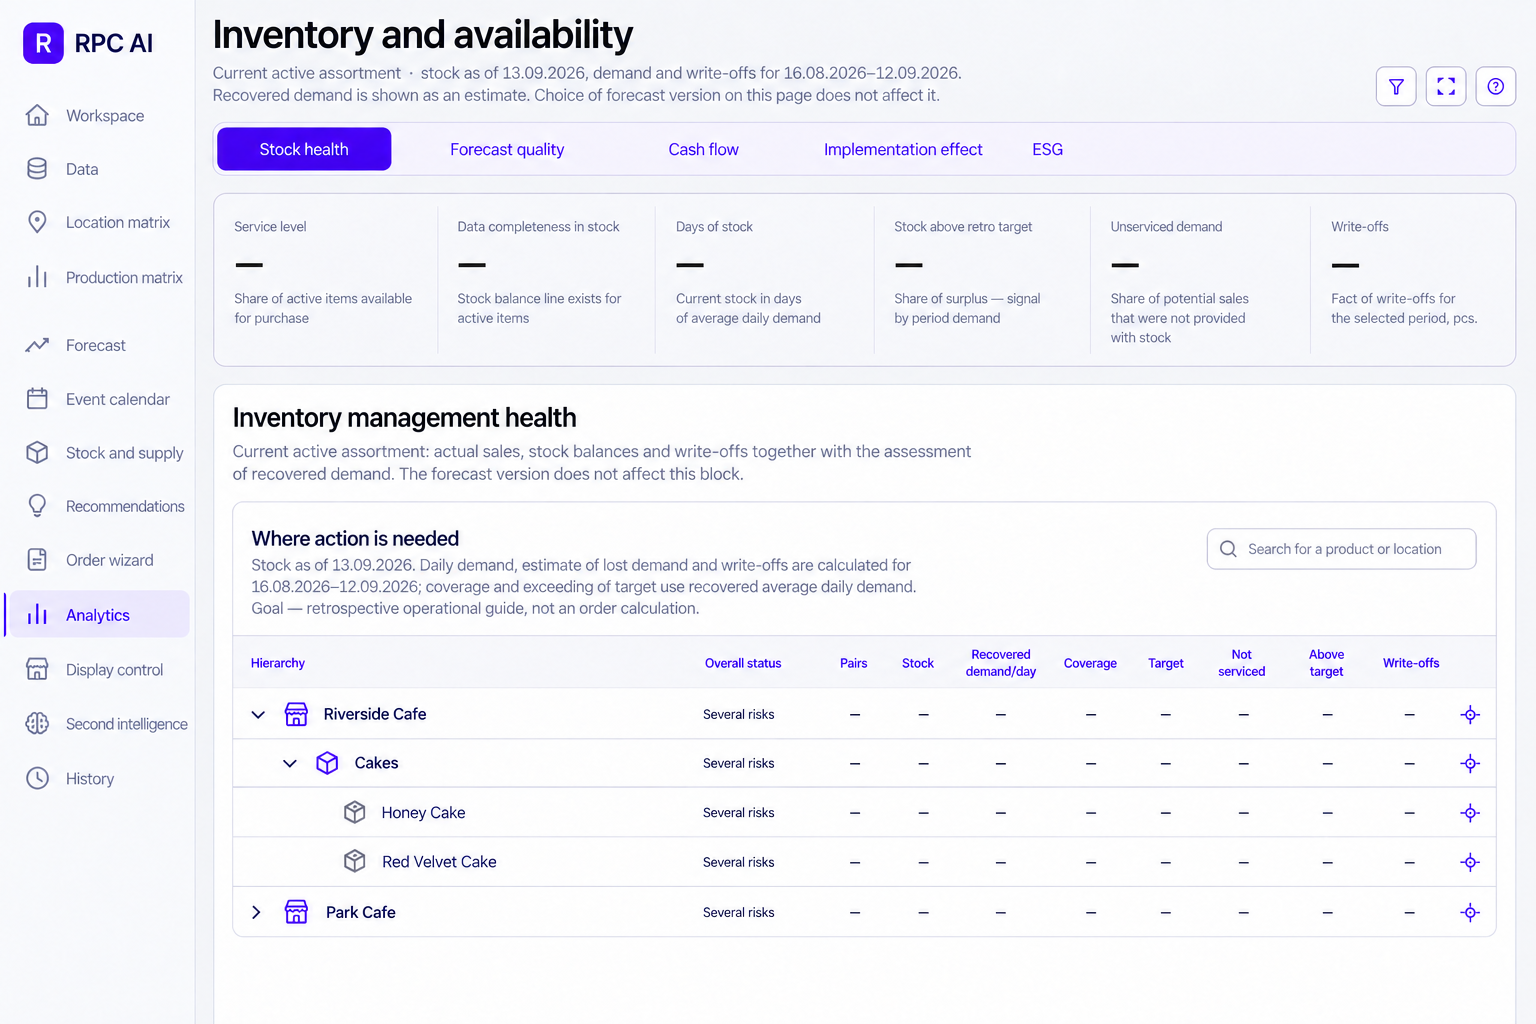
See where inventory needs attention.
Move from the overall picture to a category, product and location. Availability, write-offs and demand estimates are considered alongside source-data completeness.
Inventory health
Review availability, days of stock, surplus and write-offs in one structure.
Period and object filters help you move from an overall indicator to the items that need work.
English translation of the original RPC AI interface.
1 / 4
Second Intelligence. From plan to decision.
One AI studies demand. Another helps explain what changed and where your decision is needed. Second Intelligence shows what needs attention, which data supports the conclusion and what to check before acting.
Notice what averages hide.
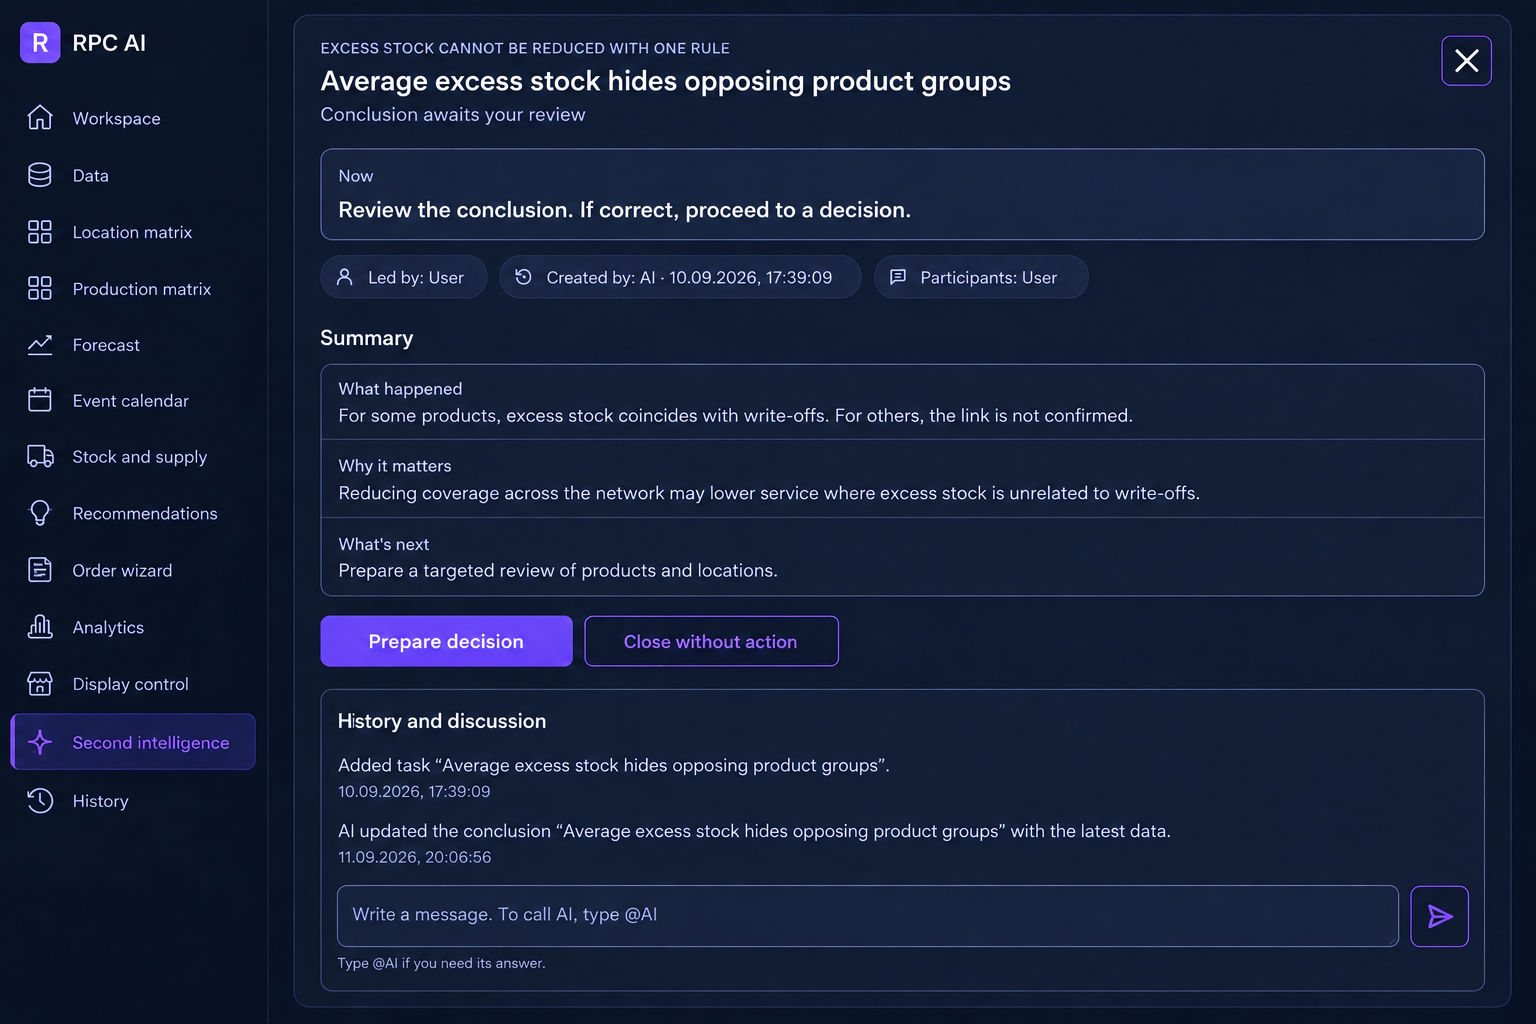
A network-wide surplus can hide very different local situations. Second Intelligence assembles an observation into a card: what happened, why it matters and what to check next.
A meaningful finding
Each card describes a concrete situation, its business relevance and the next verification step.
Discussion in context
Messages and history stay beside the finding. Bring AI into the discussion with @AI.
Human decision
Preparing a decision or closing a card without action is a separate, deliberate choice.
See the evidence and the limits.
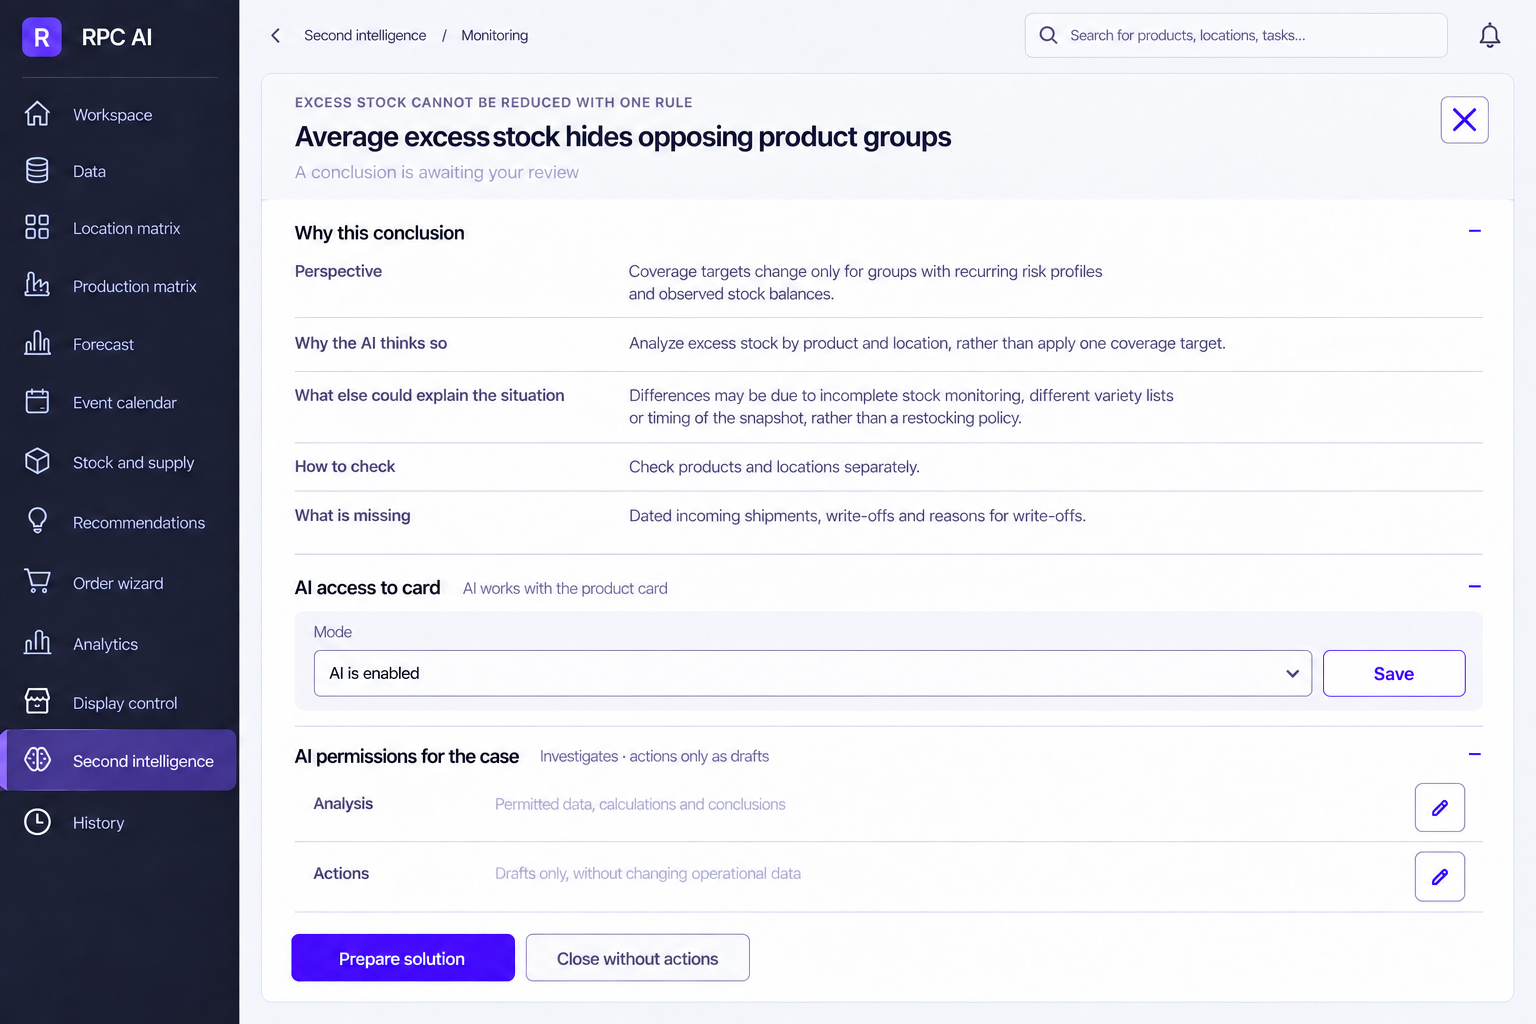
Understand why AI reached its conclusion, which alternative explanations exist and what data is still missing.
Reasoning you can check
The rationale, supporting data and verification method are collected in the same card.
Alternative explanations
Incomplete stock records, assortment differences and snapshot timing can change the meaning of a result. Those limitations should be visible.
Defined permissions
Access to a card, investigation and actions are controlled separately. Preparing a draft does not change operational data.
An assistant beside your working screen.
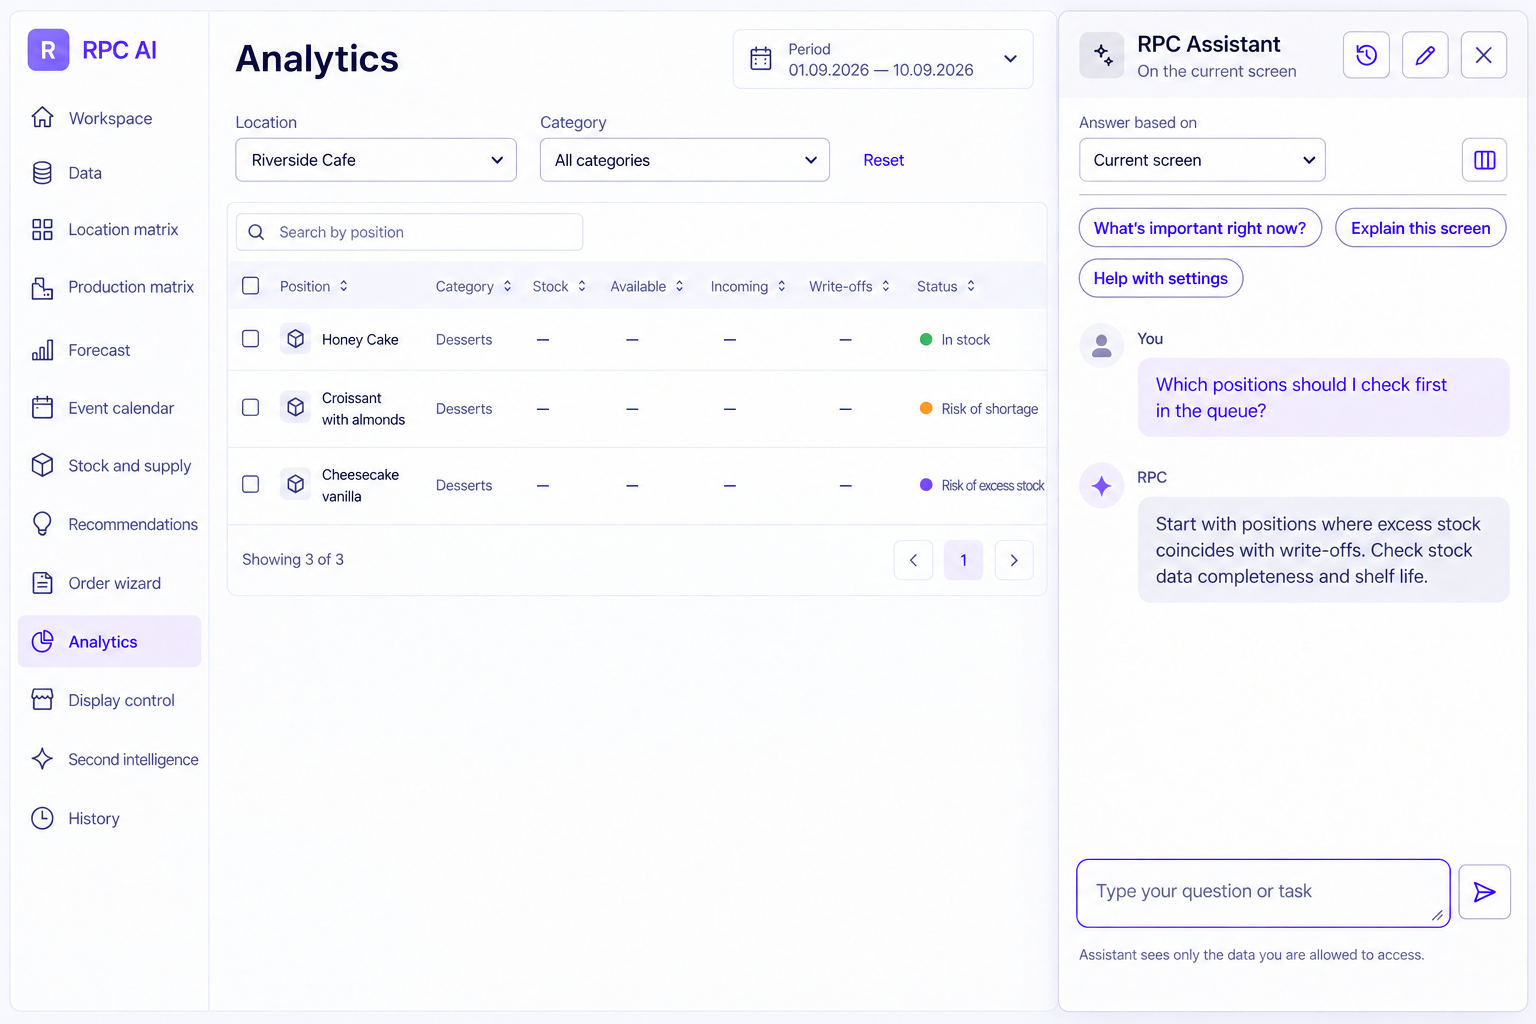
Ask about what is open: which items matter most, how to interpret a metric or where to change a setting.
Current-screen context
You do not need to describe the whole table again. The scope of the answer is defined alongside the question.
A practical starting point
“What matters now?”, “Explain this screen” and “Help with settings” let you begin with a specific task.
Permitted data
The assistant works within the user’s data access and permissions.
English translation of the original RPC AI interface.
1 / 3
RPC AI calculationInvestigate the causesHuman decision
Less inventory. More availability.
An illustrative business case: how planning can release working capital and improve daily decisions.
Before RPC AI
€300k - €800k
inventory value
20 - 30% of stock is excess, slow-moving or misallocated.
Frequent stockouts on fast-moving products.
15 - 20 hours a week spent on planning.
Reactive decisions based on spreadsheets and intuition.
With RPC AI
€20k - €60kworking capital released
5 - 10%reduction in excess inventory
2 - 8%revenue uplift from better availability
30%less time manually updating spreadsheets
5%expected gross profit uplift
€8k - €15kpositive financial impact per month
Target payback: within 2 months of deployment.
Illustrative estimates, not a measured customer result or a guaranteed outcome. The ranges reflect different business situations and are not a single financial calculation. Actual impact and payback depend on inventory mix, availability, margins and implementation.
Start with one chosen process.
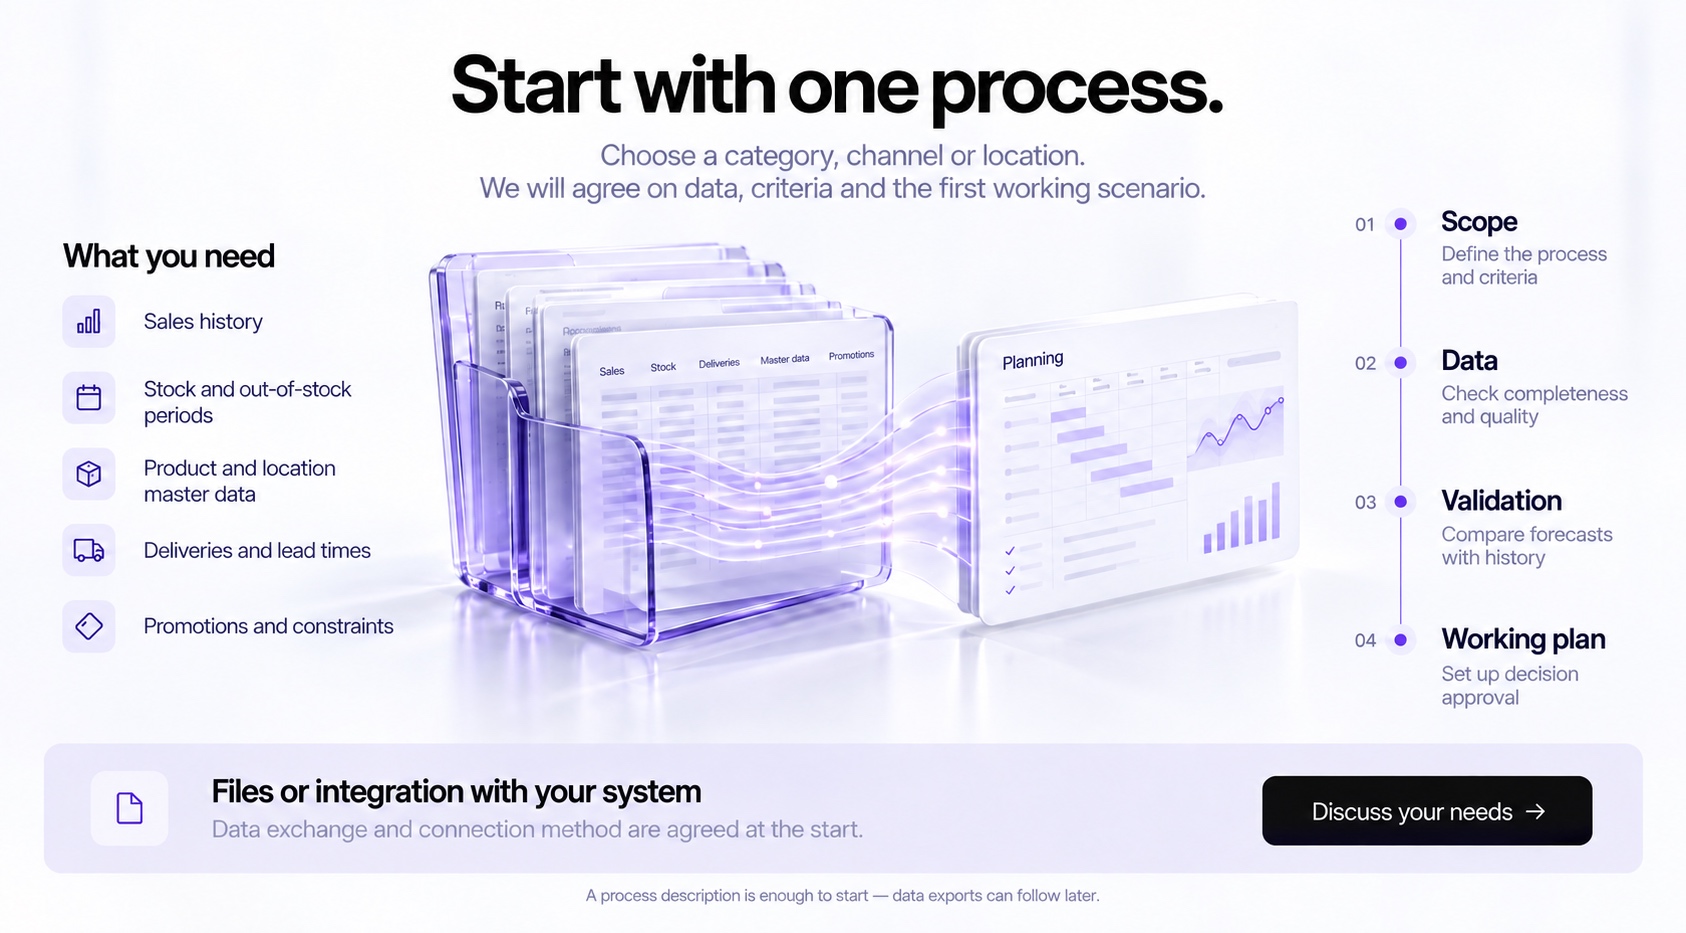
Describe what you plan today and where the difficulty arises. Together, we will define the first working scenario, data and evaluation criteria.
Data for planning
Sales and stock, product and location master data, deliveries, lead times, promotions and constraints.
ERP data exchange
Your ERP records operations; RPC AI uses them for planning. Data can move through files or an integration. We agree the inputs and returned results for your system.
A result you can verify
First, establish the current process and baseline metrics. Then compare the forecast and working plan with that baseline.
Pricing by network scale.
Standard data connection and integration included.
RPC AI Start
€300per month
Unlimited SKUs
Unlimited e-commerce & marketplaces
Up to 5 physical locations
1 warehouse, DC or plant
Up to 5 named users
RPC AI Network
€450per month
Unlimited SKUs
Unlimited e-commerce & marketplaces
Up to 20 physical locations
Up to 3 warehouses, DCs or plants
Up to 20 named users
RPC AI Scale
€600per month
Unlimited SKUs
Unlimited e-commerce & marketplaces
Unlimited physical locations
Up to 10 warehouses, DCs or plants
Up to 100 named users
RPC Complex
€990per month
Unlimited SKUs
Unlimited e-commerce & marketplaces
Unlimited physical locations
Unlimited warehouses, DCs & plants
Up to 100 named users
Multi-echelon network
Warehouse & DC transfers
Every plan includes promotion effects and AI demand forecasting.
Six- and twelve-month subscriptions are paid upfront. All prices are in EUR.
From data and forecast validation to your team’s role.
Do we need to connect the whole business at once?
You can start with a chosen category, channel or location. The first stage is defined by your task and data.
Does RPC AI replace an ERP or accounting system?
RPC AI uses data from operational systems for planning. Data exchange and returned results are agreed during setup.
How do we check forecast quality?
We compare forecasts with actuals on a held-out period of history: future data is not used to build the forecast. Out-of-stock periods are considered separately. Metrics, horizon and the baseline planning method are agreed before evaluation.
What does AI do, and what do people do?
Forecasting AI uses machine learning and automated model selection. Generative AI helps investigate causes and prepare a decision. The RPC AI core calculates inventory and supply within constraints; people confirm changes.
What data do we need to start?
Sales history, stock, product and location master data, deliveries and lead times, promotions and constraints. Start by describing the process; we will define the required exports for your task.
When do we need RPC Complex?
When several supply-chain levels, warehouse transfers and the consequences of decisions across the whole network need to be modelled together. It is a choice based on process complexity, not a required upgrade from RPC AI.
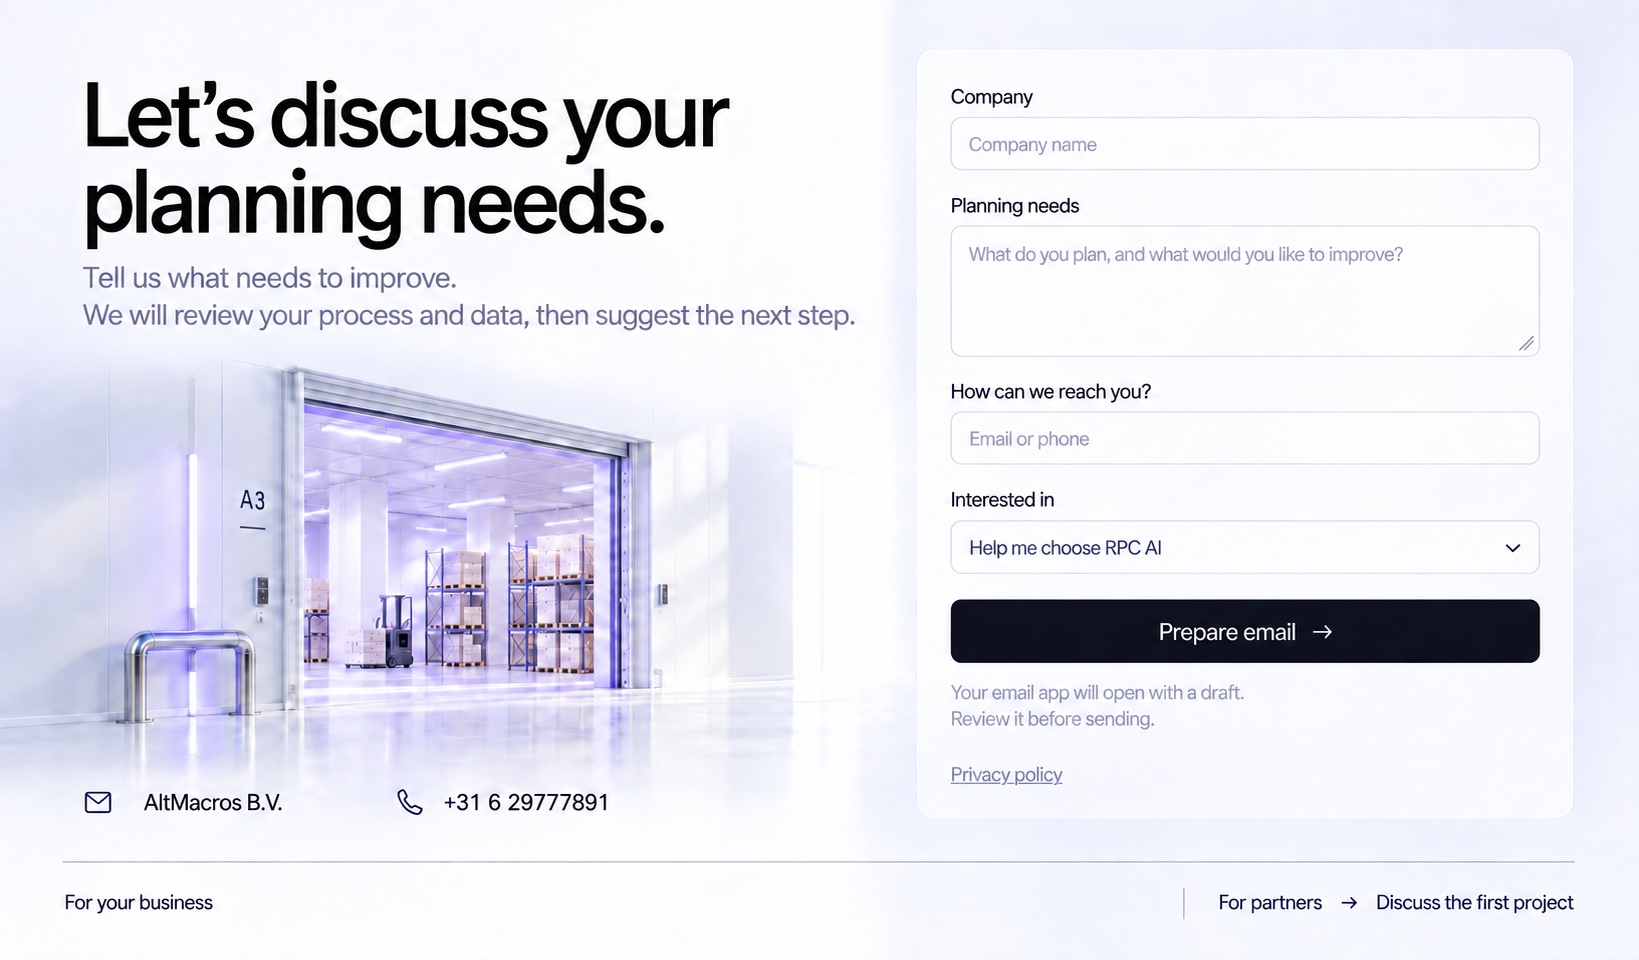
Let’s discuss your planning needs.
In the demo, we will show the journey from data and forecasts to a recommendation and a human decision.